This project was conducted through NASA’s SEES (STEM Enhancement in Earth Science) research program at the UT Austin Center for Space Research (CSR), where I was selected to work as a remote-sensing researcher focused on large-scale climate systems. My role was to transform raw satellite data into interpretable insights about how global climate cycles drive real-world disasters. This project analyzed more than two decades of Earth-observing satellite data to understand how climate patterns evolve and intensify across entire regions.
Project Description
A NASA-backed climate research project using satellite data to detect inverse disaster patterns between Texas and Australia across El Niño and La Niña cycles.
Team
Jia Gill
Haelin Lee,
Shrima Narasimhan, Shruti Natala,
Matthew Noriega,
Ethan Palosh,
Aneeta Thokkadam
Haelin Lee,
Shrima Narasimhan, Shruti Natala,
Matthew Noriega,
Ethan Palosh,
Aneeta Thokkadam
Role
Research Intern
Duration
June 2022 - Sept. 2022
About
Background
Problem
Climate change is not captured by any one signal — it becomes visible through patterns that appear when satellite measurements are examined together across regions and years. While NASA collects immense volumes of satellite data on rainfall, soil moisture, vegetation, wildfire, and ocean temperature, these datasets are produced by different missions and are often analyzed separately unless they are explicitly fused. Without integrating these signals into a unified view, it becomes much harder to see how large-scale climate cycles drive local disasters.
Opportunity Context
El Niño / La Niña
El Niño and La Niña are global climate oscillations that fundamentally rewire Earth’s weather systems. These cycles influence precipitation, temperature, drought, wildfire risk, and ocean behavior across the planet, making them one of the strongest natural drivers of climate variability. By anchoring the analysis to ENSO cycles rather than individual years, this project could examine how entire climate systems shift between extreme states — revealing patterns that would be invisible in short-term or single-event studies.
Why Texas and Australia
El Niño and La Niña are global climate oscillations driven by above- and below-average sea surface temperatures in the equatorial Pacific. These cycles shift the Pacific Jet Stream, alter ocean upwelling, and redistribute heat and moisture across the planet — producing opposite climate effects in different parts of the world.
Texas and Australia sit on opposite ends of these oscillations. During La Niña, colder Pacific waters shift the jet stream northward, bringing warmer, drier conditions to the southern United States while intensifying rainfall and flooding in parts of Australia. During El Niño these patterns reverse. Because of this, climate disasters such as drought, wildfire, flooding, and vegetation loss are expected to show inverse behavior between these two regions across ENSO cycles.
Texas and Australia sit on opposite ends of these oscillations. During La Niña, colder Pacific waters shift the jet stream northward, bringing warmer, drier conditions to the southern United States while intensifying rainfall and flooding in parts of Australia. During El Niño these patterns reverse. Because of this, climate disasters such as drought, wildfire, flooding, and vegetation loss are expected to show inverse behavior between these two regions across ENSO cycles.
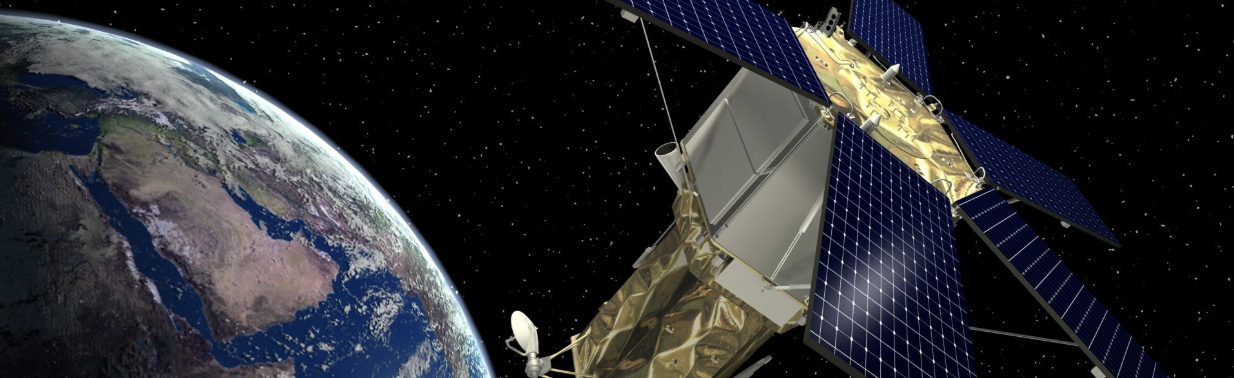
GRACE-MODIS Dataset
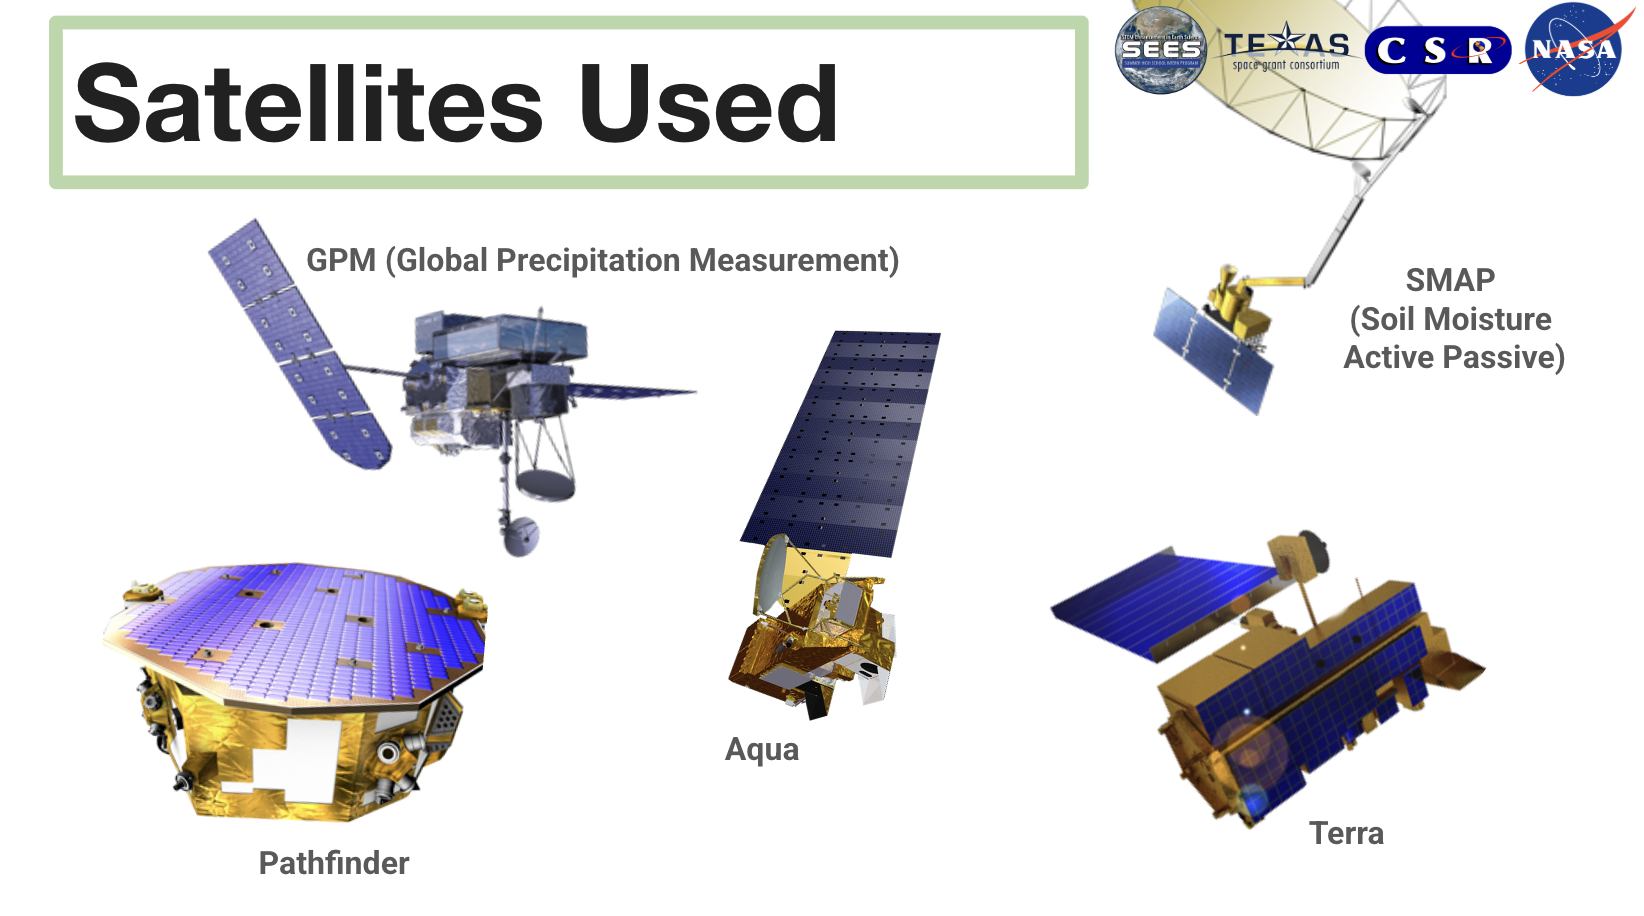
To capture both the hidden and visible sides of climate change, this project combined two complementary satellite systems: GRACE and MODIS. GRACE measures changes in Earth’s gravity field, allowing scientists to detect underground water loss and drought stress, while MODIS captures surface-level signals such as vegetation health, wildfires, and land temperature. Using Google Earth Engine to access and process these datasets enabled large-scale, time-aligned analysis across more than 20 years of global observations.
Challenge
While this project was conducted as a scientific study, I approached it with the same mindset I use in product design: framing a clear challenge, defining success, and building a system that turns raw signals into actionable insight.
.png)
Research
Research Methodology
To test whether Texas and Australia exhibit inverse climate disaster patterns across El Niño and La Niña cycles, the research team built a multi-dataset remote-sensing analysis pipeline that combined satellite observations across time, geography, and environmental variables.
The 2000–2021 study period was first segmented into El Niño, La Niña, and neutral years using ENSO phase classifications. This allowed all satellite measurements to be aligned to the same underlying climate state rather than calendar time, enabling direct comparison of climate behavior across different ENSO phases.
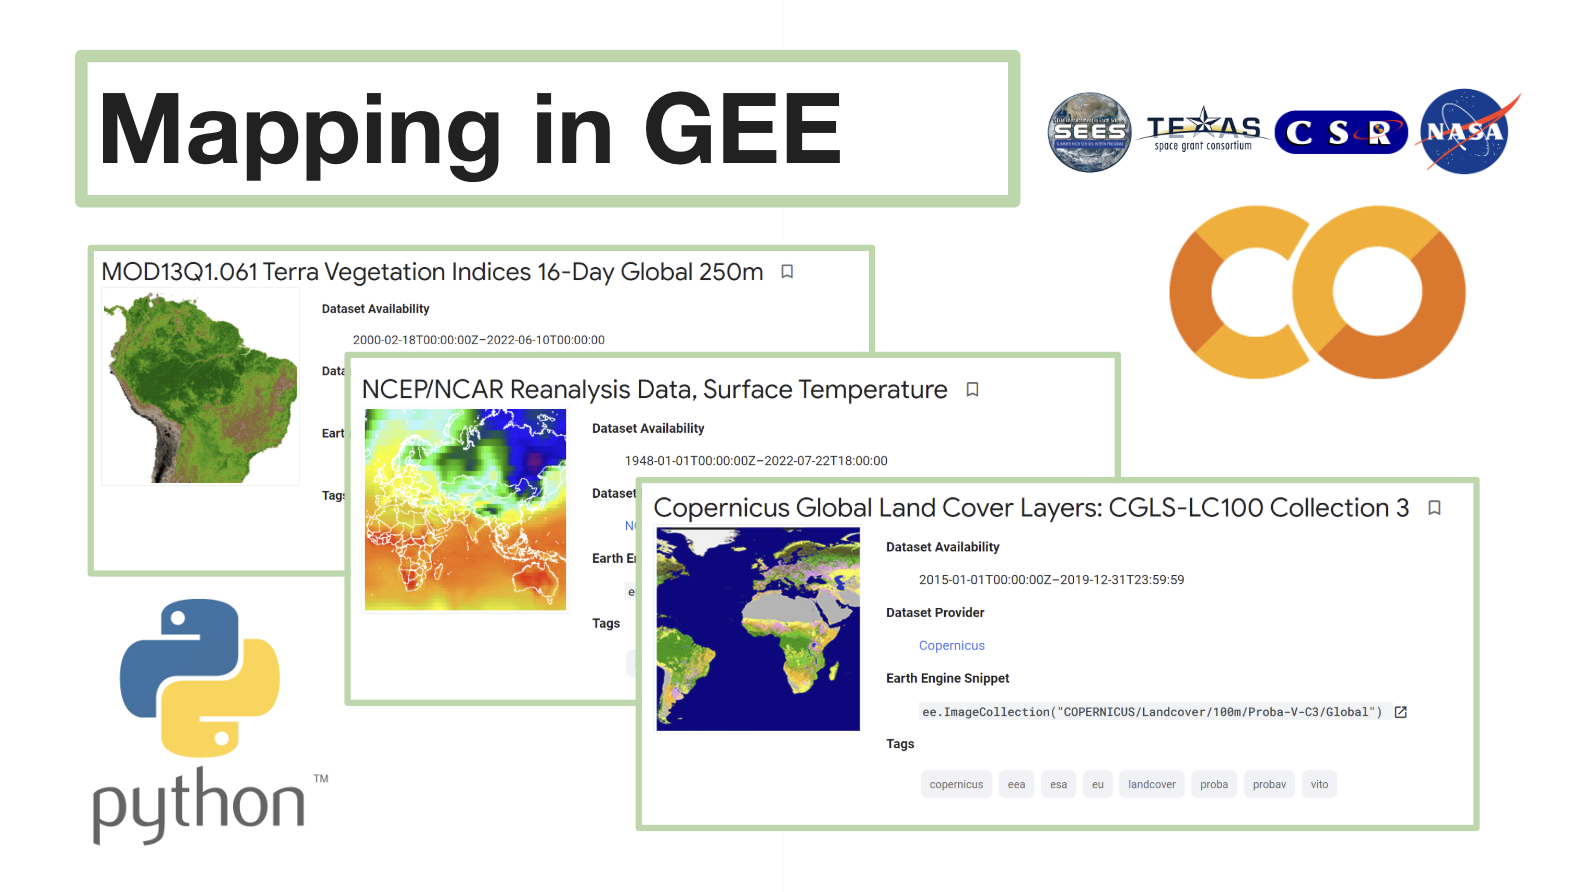
Satellite-derived datasets from NASA’s GRACE and MODIS missions were accessed through Google Earth Engine. GRACE data was used to measure changes in groundwater and terrestrial water storage, while MODIS provided surface-level observations of vegetation health, land surface temperature, and wildfire activity. Additional global precipitation and soil-moisture datasets were incorporated to capture both heat-driven and water-driven climate stress.
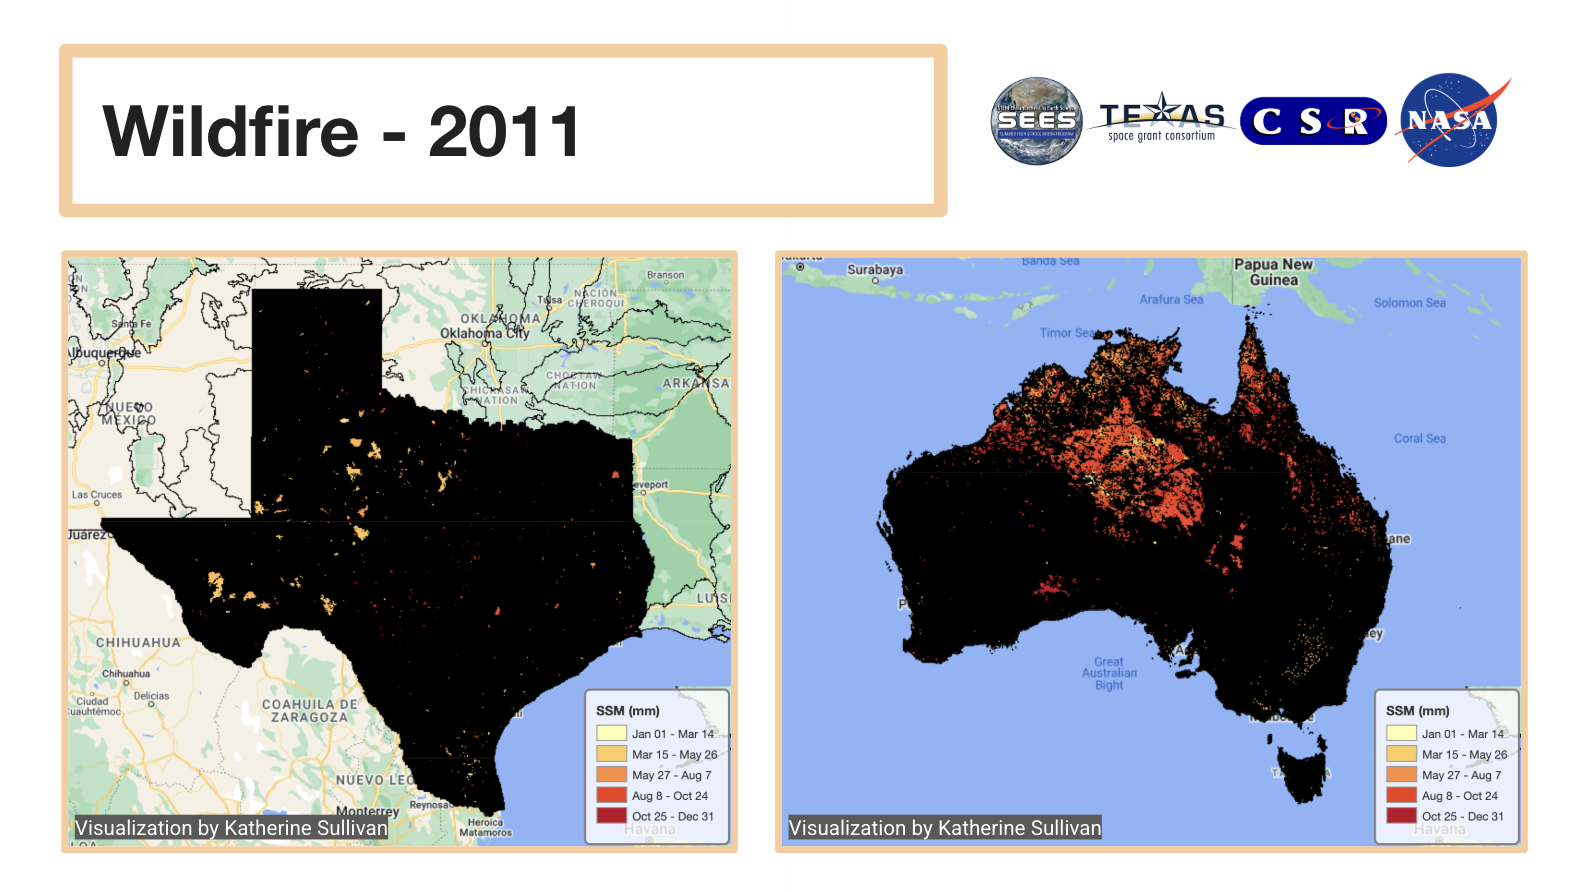
To make these signals comparable across continents, all datasets were spatially and temporally normalized and summarized by ecoregion for Texas and Australia. For wildfire analysis, a global burned-area dataset was used to calculate the average number of square kilometers burned per ecoregion for each ENSO phase between 2000 and 2021. For hydrological risk, precipitation, humidity, and soil-moisture data were combined to map areas vulnerable to flooding and drought.
All data processing and analysis were conducted in Python using Google Colab, with pandas for time-series analysis, matplotlib for visualization, and geemap for geospatial mapping. This workflow enabled the creation of synchronized maps, timelapse visualizations, and trend charts that revealed how climate disaster patterns shifted between Texas and Australia across El Niño and La Niña cycles.
The 2000–2021 study period was first segmented into El Niño, La Niña, and neutral years using ENSO phase classifications. This allowed all satellite measurements to be aligned to the same underlying climate state rather than calendar time, enabling direct comparison of climate behavior across different ENSO phases.
Satellite-derived datasets from NASA’s GRACE and MODIS missions were accessed through Google Earth Engine. GRACE data was used to measure changes in groundwater and terrestrial water storage, while MODIS provided surface-level observations of vegetation health, land surface temperature, and wildfire activity. Additional global precipitation and soil-moisture datasets were incorporated to capture both heat-driven and water-driven climate stress.
To make these signals comparable across continents, all datasets were spatially and temporally normalized and summarized by ecoregion for Texas and Australia. For wildfire analysis, a global burned-area dataset was used to calculate the average number of square kilometers burned per ecoregion for each ENSO phase between 2000 and 2021. For hydrological risk, precipitation, humidity, and soil-moisture data were combined to map areas vulnerable to flooding and drought.
All data processing and analysis were conducted in Python using Google Colab, with pandas for time-series analysis, matplotlib for visualization, and geemap for geospatial mapping. This workflow enabled the creation of synchronized maps, timelapse visualizations, and trend charts that revealed how climate disaster patterns shifted between Texas and Australia across El Niño and La Niña cycles.
Goals
- Quantify ENSO-driven climate risk
Identify how El Niño and La Niña cycles shape drought, wildfire, flooding, and vegetation stress in Texas and Australia. - Detect inverse regional patterns
Test whether climate disasters in Texas and Australia behave oppositely across ENSO phases, as predicted by climate theory. - Enable forward-looking risk prediction
Generate maps and metrics that can be used to anticipate where future La Niña or El Niño events may intensify climate disasters.
Technologies
- Google Earth Engine
Cloud-based platform for accessing and processing multi-petabyte satellite datasets. - NASA GRACE & MODIS datasets
GRACE for groundwater and terrestrial water storage; MODIS for vegetation, land surface temperature, and wildfire activi - Python (Colab)
Used for time-series analysis, ENSO phase alignment, and statistical processing. - geemap
Interactive geospatial visualization and map generation. - pandas & matplotlib
Used to aggregate ecoregion statistics and visualize climate trends across ENSO cycles.

Findings
Takeaways
Across more than two decades of satellite observations, the analysis revealed a consistent inverse relationship between Texas and Australia across ENSO years. When drought, wildfire, and vegetation stress intensified in one region, the other experienced increased precipitation, flooding, and vegetation recovery — and vice versa.
This pattern appeared across every environmental variable examined, including land surface temperature, wildfire burn area, vegetation indices, precipitation, humidity, flooding, and surface soil moisture. The strongest contrasts emerged during extreme ENSO years, such as the 2011 La Niña when wildfire activity surged across Australia while much of Texas experienced comparatively lower burn intensity and higher moisture.
To make these dynamics visible, our team produced a collection of geospatial maps, timelapse animations, and time-series charts that showed how climate stress migrated between continents as ENSO cycles shifted. These visualizations allowed researchers to see not only where disasters were occurring, but how entire climate systems were reorganizing over time.
Why it Matters
By confirming that Texas and Australia behave as climatic opposites across El Niño and La Niña cycles, our work enables more reliable forecasting of where climate disasters are likely to intensify next. When an ENSO phase begins to emerge, historical patterns can now be used to anticipate whether a region is more vulnerable to drought, wildfire, flooding, or vegetation loss. These insights support early warning systems, emergency preparedness, and long-term climate adaptation planning — helping governments and communities allocate resources before disasters reach their peak.
Scientific Impact
The results were presented at the American Geophysical Union (AGU) conference and shared with 100+ NASA scientists and engineers at the SEES research symposium. By combining multiple Earth-observing datasets into a unified analytical framework, the project demonstrated how remote sensing can be used not just to observe climate change, but to predict how and where its impacts will unfold.

Reflection
What did I learn working on this project?
This project taught me how to think in systems rather than isolated variables. Working with satellite data forced me to move beyond surface-level patterns and ask deeper questions about causality, uncertainty, and scale. I also learned how to translate raw scientific data into visual stories that humans can actually interpret, which later became foundational to how I approach product and design.
What would I have done differently?
With more time and computing resources, I would have extended the analysis to additional ENSO-sensitive regions to test whether similar inverse relationships exist elsewhere. I also would have built a more interactive exploration layer so policymakers and researchers could query the data directly instead of relying on static maps. The project showed me how powerful these insights could be — and how much more could be unlocked with better tooling.
How has this experience prepared me for my next project?
This experience fundamentally shaped how I approach any complex problem. It taught me how to form hypotheses, design analytical systems, validate them with real data, and communicate insights visually. Whether I’m working on climate, social platforms, or consumer products, the same process applies: understand the system, find the signal, and build tools that make invisible patterns visible.